
There are two indicators for evaluation criteria.
As the lens size of the mobile phone is getting higher and higher, everyone began to pay more attention to how to scientifically and accurately evaluate the performance of a lens. Before that, we first understand the resolution and contrast of the two important indicators of the lens evaluation.
Resolution is also called resolution, discrimination, resolution, and the ability of a solid lens to reproduce the details of a scene. The higher the lens resolution, the sharper the image. Its unit is "LP/MM". The adjacent black and white lines can be called a pair. The number of lines that can be distinguished per millimeter is the resolution, which is like the fineness of the zebra crossing. The denser the resolution, the higher the resolution.
Contrast, also known as sharpness, is the ability to vividly reproduce the middle, dark, low contrast, fine contrast and subtle color changes of the scene. The lens with high contrast has a clear outline, sharp edges, normal contrast, rich layers and true color reproduction.
The comprehensive performance of resolution and contrast is called resolution. A lens with a high resolution may not be rated as an excellent lens. Often some lens resolutions are not very high, but the contrast is quite good, still a good lens. Of course, it is a lens that is truly ideal.
Three ways to evaluate the performance of the lens
So do we have an effective way to evaluate lens performance? Next, briefly describe several evaluation methods;
Method 1: The MTF (Modulation Transfer Function) test is the most accurate and scientific method for lens evaluation. Because MTF eliminates the influence of chips and software and can objectively reflect the performance of the lens, it is widely used in the research and testing of optical products.
MTF is a function of the relative spatial frequency of the ratio of the actual modulation to the ideal image. It is common to measure the degree of reduction of the lens contrast at different spatial frequencies. It can reflect the contrast and resolution of the lens at the same time. Because the actual optical system has aberrations, reflections, absorption and other factors, the contrast between the image and the standard cannot be completely consistent, so the MTF is always between 0 and 1. The larger the MTF value, the clearer the image. As shown in Figure 1, the MTF = 0.4 is the clearest; when MTF = 0.05, the image is the most blurred.

So how do you judge the quality of the lens by MTF? We will give a general introduction to Figure 2. The abscissa is the spatial frequency, and the unit of spatial frequency is lp/mm, which is very close to the resolution concept. The ordinate is the MTF value. The curve represents the MTF value of the lens at different frequencies. It can be seen from the figure that as the spatial frequency increases, the lens MTF gradually decreases. If the abscissa extends infinitely, it will find that the curve tends to zero infinitely. In order to better describe the MTF curve, we add three curves A, B, and C and corresponding pictures to describe.
Curve A indicates that the lens is moderate in the low frequency band MTF. With the increase of the spatial frequency, the attenuation process is slow, and the comprehensive performance of contrast and resolution is better. From Fig. A, it can be seen that the contrast of dark and light colors is obvious, the details of the hair are fine, and the overall reduction is better. it is good.
Curve B low frequency MTF is the best in comparison, indicating that the contrast of the lens is very good, but with the increase of spatial frequency. Its attenuation is very fast, indicating that the lens resolution is not very good. From Figure B, it can be found that the fluff details at the kitten's ear are difficult to distinguish.
Curve C indicates that the MTF decays quickly at low frequencies and the overall performance is poor. It can also be seen from Figure C that the contrast between the shades of the picture is low and the layering is poor.
The above revelation to us is that the lens definition and R&D will not pursue the extremes of a certain aspect, so it is often too late to comprehensively consider the high and low frequency uniform smooth transition to make an excellent lens product.

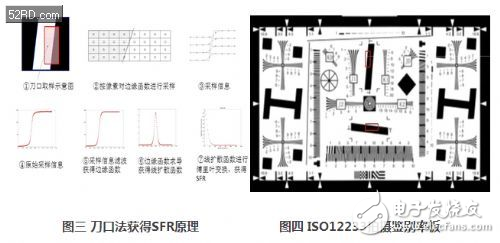
Method 2: SFR (Spatial Frequency Response) is the response of the module to different spatial frequencies, similar to the MTF algorithm, but the test results are affected by both the lens and the sensor and the processing program (SFR=lens MTF*sensor MTF*ISP MTF), so this algorithm is called spatial frequency response SFR. In fact, SFR is equivalent to MTF simplified version and is widely used in module evaluation.
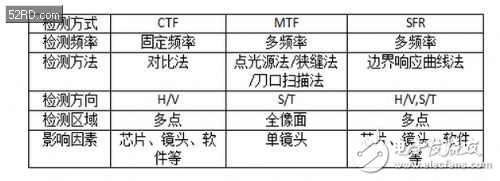
The SFR data processing process is described in Figure 3, but it is not covered here. There are two kinds of hypotenuses for SFR calculation, one is a horizontal bevel and the other is a vertical bevel. As shown in Figure 4, two red boxes, the larger the width is called the horizontal bevel, and the higher the height is called the vertical bevel. In the case of the horizontal sharpness, we use the vertical bevel and test the vertical direction. The sharp bevel is used for sharpness.
In the analysis of SFR, the domestic market tends to use the MTF value at a fixed frequency to judge the pros and cons of imaging. For example, the larger the MTF value at a fixed frequency of @112 lp/mm, the better the imaging quality. The European and American markets are more inclined to measure the quality of the image at a fixed MTF frequency. In the case of MTF30, the higher the frequency, the better the imaging quality. MTF30 generally uses LW/PH as the unit, that is, how many lines are resolved per image, LW/PH=frequency* narrow side image height*2. In fact, the purpose of these two methods is the same, only the difference in thinking at home and abroad.
In the actual evaluation, most of the modules will sharpen the image to different degrees to improve the image clarity. In the SFR curve, the black and red curves are used to distinguish the data before and after sharpening. The black solid line indicates the raw data that has not been sharpened, and the red dotted line indicates the data after the sharpening effect on the module image is removed. .

Method 3: CTF (contrast transfer function) is called contrast transfer function, which indicates the fixed line width of the object (ie, the fixed object space frequency) lens response contrast, ie: CTF=(Imax-Imin)/(Imax+Imin), So CTF is always less than or equal to 1, I: intensity (light intensity) Imax: the brightest light intensity Imin: the darkest light intensity. This parameter is useful for evaluating measurement edge contrast. The CTF value is obtained by contrast calculation, which can only test the black and white contrast state of a specific frequency. This detection method is simple and convenient, but the stability and accuracy cannot be compared with the previous two methods.
We can also easily distinguish the difference between CTF/MTF/SFR by detecting frequency and method:
Note:
1 Modulation is actually the ratio of brightness ratio: M = (Imax - Imin) / (Imax + Imin), the original sinusoidal grating with modulation degree M, the degree of modulation of the image that reaches the image plane through the lens is M ', then MTF = M '/M
Iron Battery,Nife Batteries Australia,Nife Battery 600Ah For Asutralia,Ni-Fe Battery 450~600Ah
Henan Xintaihang Power Source Co.,Ltd , https://www.taihangbattery.com