
Key frequency-related controls such as frequency range, center frequency, resolution bandwidth (RBW), and measurement time all affect the measurement results.
The frequency range refers to the total spectral component that the analyzer can capture, and the center frequency corresponds to the center of the frequency range. It should be noted that frequency controls such as frequency range determine the frequency range on the front panel of the instrument. On the other hand, depending on the size of the frequency range, the FFT signal analyzer has two distinct acquisition modes.
The realization of the frequency range up to RBW in the instrument is to down-convert a section of frequency and then digitize the down-converted signal. For the frequency range beyond RBW, the frequency bands are converted and digitized in sequence. RBW controls the frequency resolution on the frequency axis. In a traditional analyzer, a narrow-band filter is used to scan the frequency range to achieve spectrum display. The bandwidth of the filter determines the resolution on the frequency axis, so it is also a sign of control.
At the same time, analyzers using FFT do not have analog filters, but use FFT and related windowing parameters to determine frequency resolution or RBW. Unlike traditional spectrum analyzers, the latest analyzers using FFT can choose a window to limit the spectrum leakage and improve the resolution of the smaller frequency bands in the frequency domain. Those familiar with FFT analyzers and FFTs may ask, what is the relationship between RBW frequency resolution and the width of FFT taps? Table 1 shows the relationship between the RBW frequency resolution parameters (specified RBW resolution at 3dB and 6dB) and the FFT tap width in the new RF signal analyzer.

Table 1: The resolution of the RBW frequency analysis is related to the tap width of the FFT analyzer.
Analyzers using FFT have window selections to limit spectral leakage and improve the resolution of smaller-spaced spectra in the frequency domain. The traditional spectrum analyzer does not have this function. The measurement time (or scan time) of a conventional scanning analyzer is inversely proportional to the square of RBW, which is determined by the settling time of the analog filter. If the frequency resolution is to be improved by reducing RBW, the scan time will increase exponentially.
On the contrary, as the RBW decreases, the acquisition performed by the FFT signal analyzer is longer and the amount of calculation is greater. With the acceleration of DSP devices, the measurement speed is faster, thereby achieving higher resolution or narrower RBW measurement.
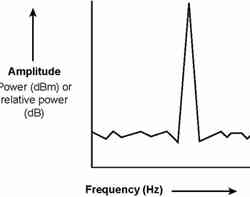
Figure 1: The relationship between the frequency and amplitude of the spectrum analyzer measurement results.
Amplitude setting
Different amplitude controls also affect the measurement results. These include the ref level, attenuator settings, and detection mode. The reference level sets the maximum input range of the spectrum analyzer. It controls the Y axis, which is similar to "volts / div" on an oscilloscope, and it must be set to just above the expected maximum power measurement.
The optimal reference level should be such that the minimum instrument distortion (caused by the very low reference level that saturates the input signal) and the minimum noise floor (the reference level is too high, reducing the sensitivity and dynamic range of the instrument) Cause) to achieve balance. Sometimes, setting a low reference level is good for wideband noise measurement, although some instrument distortion is produced. When distortion can be recognized, this will improve the sensitivity of the instrument and ensure that it is excluded from the measurement.
The attenuator setting control also determines the input range of the instrument. This setting is usually set to automatic mode, and the software adjusts the value of the attenuator according to the reference level.
In the firmware, the spectrum analyzer links the Y axis of the display with the reference level or attenuator. Virtual instruments are not limited, and the Y axis of the display can be decoupled from these controls if needed. This function can realize the visual zoom of the frequency spectrum without affecting the amplitude setting of the instrument. Note that both the reference level and the attenuator settings affect the programmable attenuator, so only one of them needs to be set.
The detection mode is another amplitude control method, which can be used in traditional scanning spectrum analyzers, but cannot be used in FFT-based analyzers. It can be divided into normal, peak, sampling, or negative peak modes. The specific detection mode determines how the spectrum analyzer reduces the spectrum information, or how to compress the spectrum information.
It also affects the total power measurement. When the spectrum data points exceed the number of points that the spectrum analyzer can display, the analyzer will benefit from the data reduction strategy. This will cause the detection mode to change the power measurement.
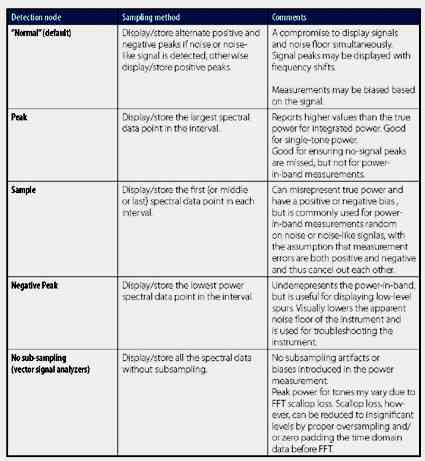
Table 2: The spectrum analyzer measurement mode can affect the power measurement result.
Factors affecting accuracy:
The spectrum analyzer uses a frequency sweep between the start and end frequencies. An analog ramp signal generates the frequency sweep signal, and the starting frequency is synthesized from a high-precision time reference signal. Therefore, the measurement accuracy is determined by the analog ramp signal and the center frequency of the IF filter.
FFT-based analyzers do not have such an analog ramp signal, so there are no limitations of these factors, so they have consistent accuracy throughout the measurement range. The accuracy within the range depends on the time base and measurement algorithm, so frequency accuracy and repeatability can be obtained relatively easily.
In traditional scanning analyzers, the causes of frequency error include reference frequency error, frequency range accuracy (5% of range) and RBW (15% of RBW). Correspondingly, the frequency error in the FFT-based analyzer includes the reference frequency error and RBW, depending on the measurement algorithm, and the variation range is between> 50% and <10% of RBW.
In order to compare these errors, the reference frequency error must be ignored, because a precision frequency source such as a rubidium clock can be used to compensate it. In a swept spectrum analyzer, when the frequency range is greater than 50kHz and the RBW setting exceeds 1kHz, the measurement performance will be affected unless the most optimized techniques are used, such as placing the 100MHz frequency in the center of the frequency range.
If a smaller RBW is used, it means that the test time is longer. This is because of the scan time problem, because the scan time of 150-200 ms is required in the usual spectrum analyzer. The measurement algorithm limits the measurement accuracy of the FFT-based analyzer. For example, the advanced spectral measurement and analysis toolkit uses interpolation technology to achieve higher resolution than RBW can achieve. As in the above example, setting RBW to 2kHz will ensure higher accuracy.
FFT-based analyzers use high RBW settings that enable accurate measurements, even if there is no measurement technique optimized for accuracy. This means that faster and more precise measurements can be achieved within the same test time. The signal analyzer can perform test samples with a length of less than 20ms, which is 6 times higher than the spectrum analyzer.
Unless the appropriate measurement settings are used, even for the same test instrument, the measurement results will vary greatly. Therefore, in-depth understanding of the working principle is essential for setting up the measuring instruments correctly.
Function: The LED Work Light has 1-5 modes;
Feature: The Led Work Light usually high power and super bright;
Trait: The products are waterproof, shockproof;
Method of application: Simple on/off push button operation;
Range of application: The LED Work Light for emergency events, camping, outdoor activities and indoor;
Adervantages: Our products are saled with factory price, and the quality can guarantee, lastly we provide warranty for 1 year.
LED Work Light
Led Work Light,Led Work Lamp,Portable Led Work Lights,Portable Work Light
Ningbo Henglang Import & Export Co.,Ltd , https://www.odistarflashlight.com